ASK THE EXPERT: Jumpstart your Azure Monitor journey
By Martin Ehrnst
Martin Ehrnst is a Microsoft Azure MVP and technical lead for Azure at Intility. In this article, he takes us through how you can begin monitoring your applications and services via Azure Monitor, even if you’re a relative beginner.
For the past decade, monitoring has been my main responsibility. I have had my hands on many of the enterprise monitoring systems out there, but System Center Operations Manager (SCOM) is where most of my working hours were spent. Now, I spend my time in Azure and since monitoring is relevant in public cloud as well. Azure Monitor is now my primary tool for my applications (and servers).
I know that starting off with an entirely new monitoring platform can be challenging, at best. Instead of figuring out all bits and pieces by yourself, I will introduce you to the key features of Azure Monitor, such as visualization and alerting. I will also briefly touch on the more advanced capabilities like custom log injection using Azure Monitors REST API.
Are Microsoft pros using Azure Monitor? Should you be too?
Our annual, independent Microsoft Azure report explores salaries, culture, and products in the Azure ecosystem – there’s no better way to learn how businesses are utilizing this technology.
After reading this you should have the basic knowledge on how to monitor your applications and servers using Azure Monitor. Details related to the various topics can be found in the official Azure Monitor documentation
Azure Monitor Logs
Logs in Azure Monitor is backed by a Log Analytics workspace. To fully utilize Azure Monitor, a Log Analytics workspace is mandatory.
With Logs, you can extend your Azure Activity Log retention, collect and analyze Server Event Logs (both built-in and custom logs are supported). Azure Monitor Logs or Log Analytics is Microsoft equivalent to for example Splunk.
To perform analysis and query data, you use a language called called KQL.
Azure Monitor metrics
A fundamental part of any monitoring platform – metrics. We all love to create fancy dashboards showing all kinds of metrics. From any resource blade in the portal, you will find a link to the resource metrics. Depending on the type of resource, you will have key metrics displayed.
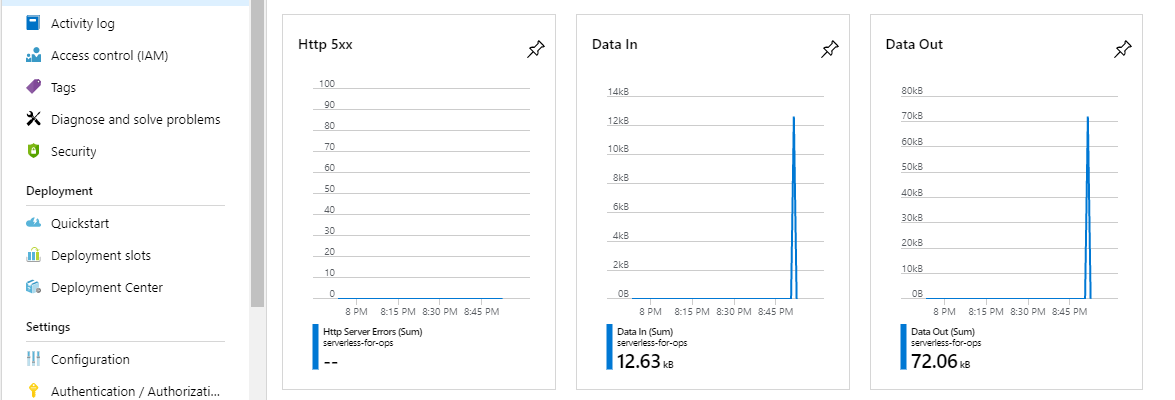
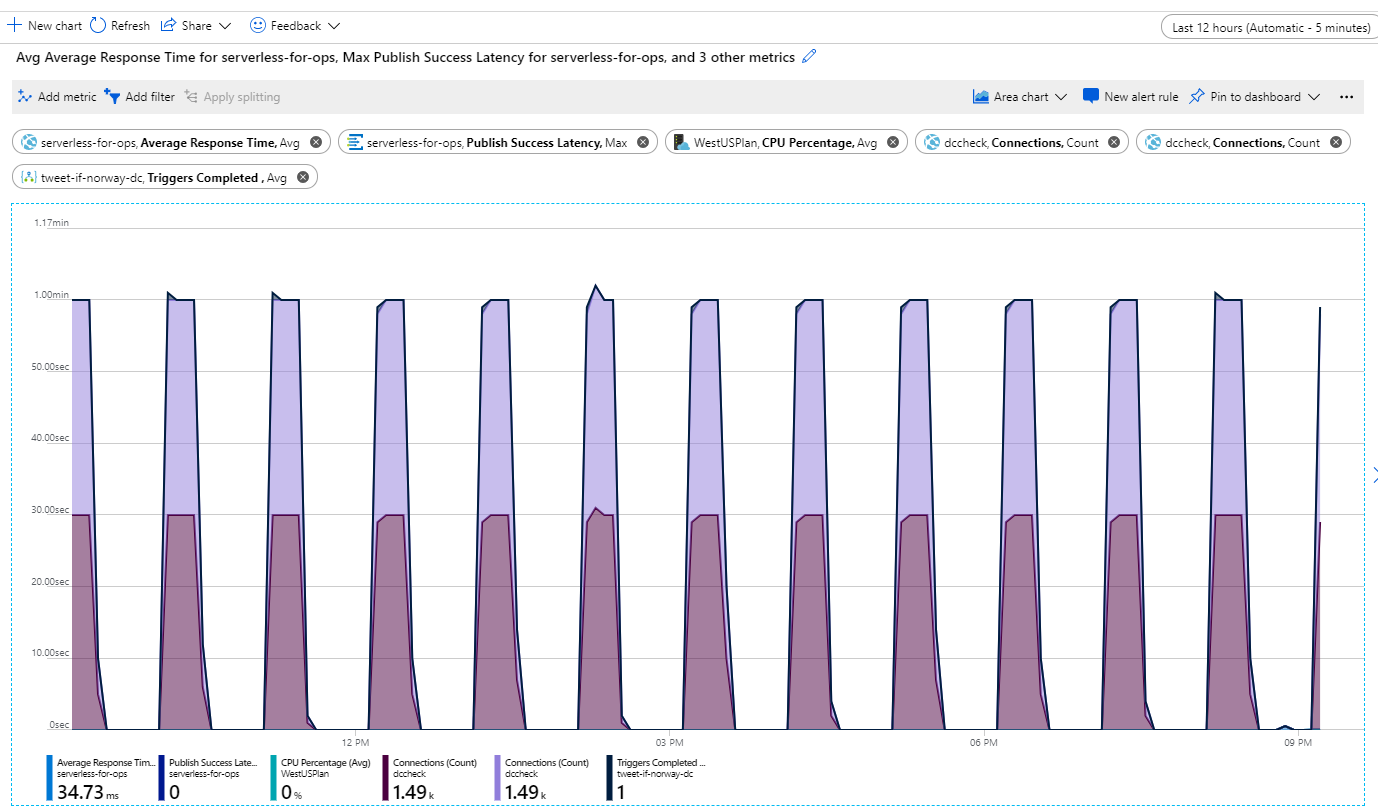
Metrics can also be added to charts and compared. Either with similar workloads or you can add multiple metrics to one chart. For example, when you have multiple Azure resources that serve as one application or service delivery. These charts can then be shared and/or added to a dashboard on the front page in Azure.
Azure Monitor alerts
Although I have been advocating for years, trying (and to some extent succeeding) to kill email alerts. Alerting is, alongside metrics, a very important to any monitoring platform. Over the years Microsoft has revamped its alerting capabilities and we now have a unified alert engine across the entire platform.
- activity log
- metrics
- security center (activity log)
- Log Analytics
- Advisor
- Cost management
- Policy (activity log)
- Sentinel
Azure Monitor alerts are very powerful, and I could write a long section on it. Instead of doing that, I can only recommend that you visit Stanislav Zhelyazkov blog. He has written a whole series of posts related to the different Alert types, and explain everything you need to know in detail.
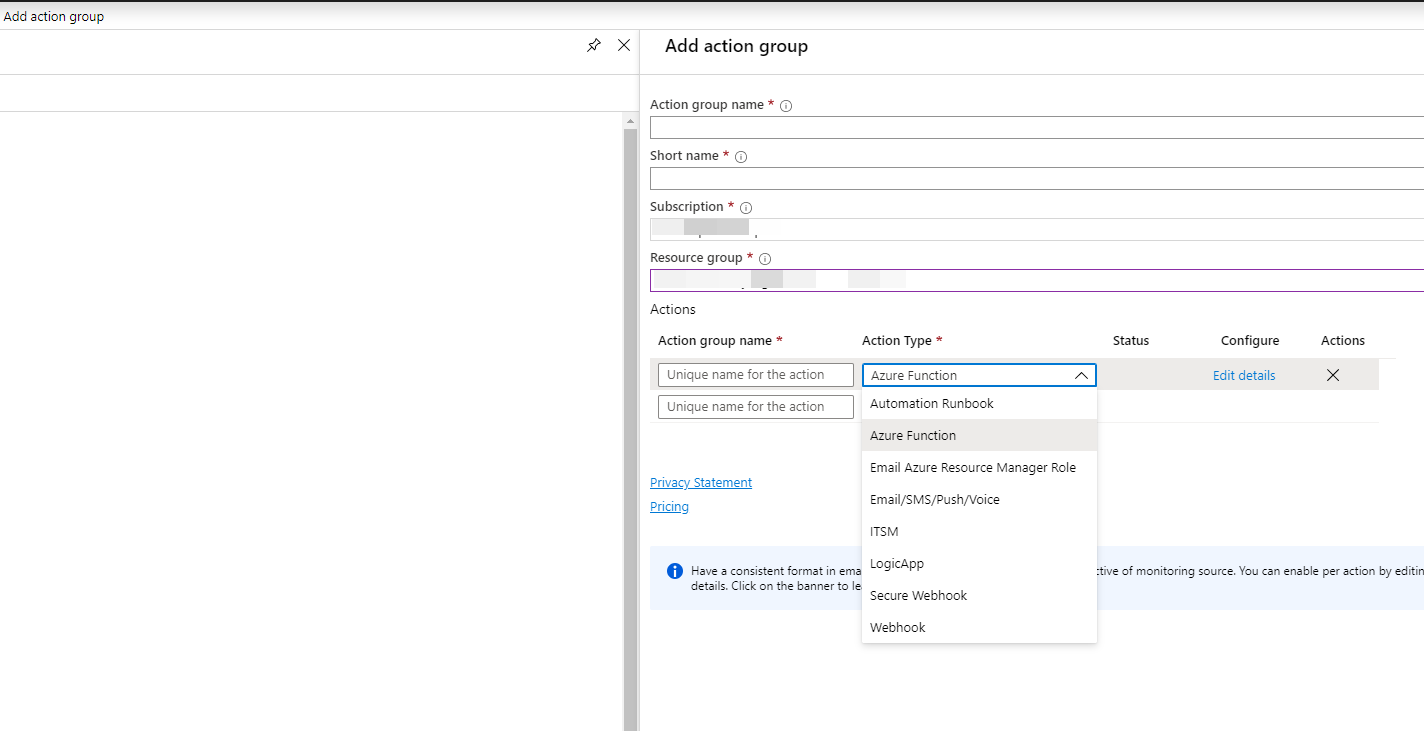
One thing I do want to point out though, is action groups. Action groups are used for notification preferences. From my experience managing multiple and large environments action groups needs governance and planning, just like anything else.
Workbooks
Made generally available during Microsoft Ignite 2019, Azure Monitor workbooks lets you create interactive reports from all data sources available in Azure Monitor. It also has some abilities to query data from external sources, like Azure Resource Graph or even a public REST API.
If you have used Azure Application Insights, you might already be familiar with workbooks. Now that AppInsights is officially a part of Azure Monitor, that capability was made available for the rest of us.
I do find workbooks a bit challenging to work with. For example, it seems to be very sensitive when it comes to Log queries. If your queries aren’t optimized and return a large dataset, the workbook will have trouble loading, and sometimes affect the whole Azure Portal. Not-so optimized queries are especially common when you’re just getting started with Azure Monitor.
If you are confused about dashboarding in Azure, you are not alone. We already have your Azure dashboard, which is customizable, but we also have view designer from log analytics. Over time I would put my money on workbooks replacing at least view designer. So be sure to create and explore workbooks. You can even contribute to Microsoft’s GitHub repo and maybe have your workbook listed.
Azure Monitor insights
Azure monitor insights utilize all aspects of Azure Monitor. Using workbooks for visualization, Microsoft has provided a set of pre-built monitoring solutions that surface the data from the relevant sources. Metrics, Logs and custom data are all combined in a uniform view.
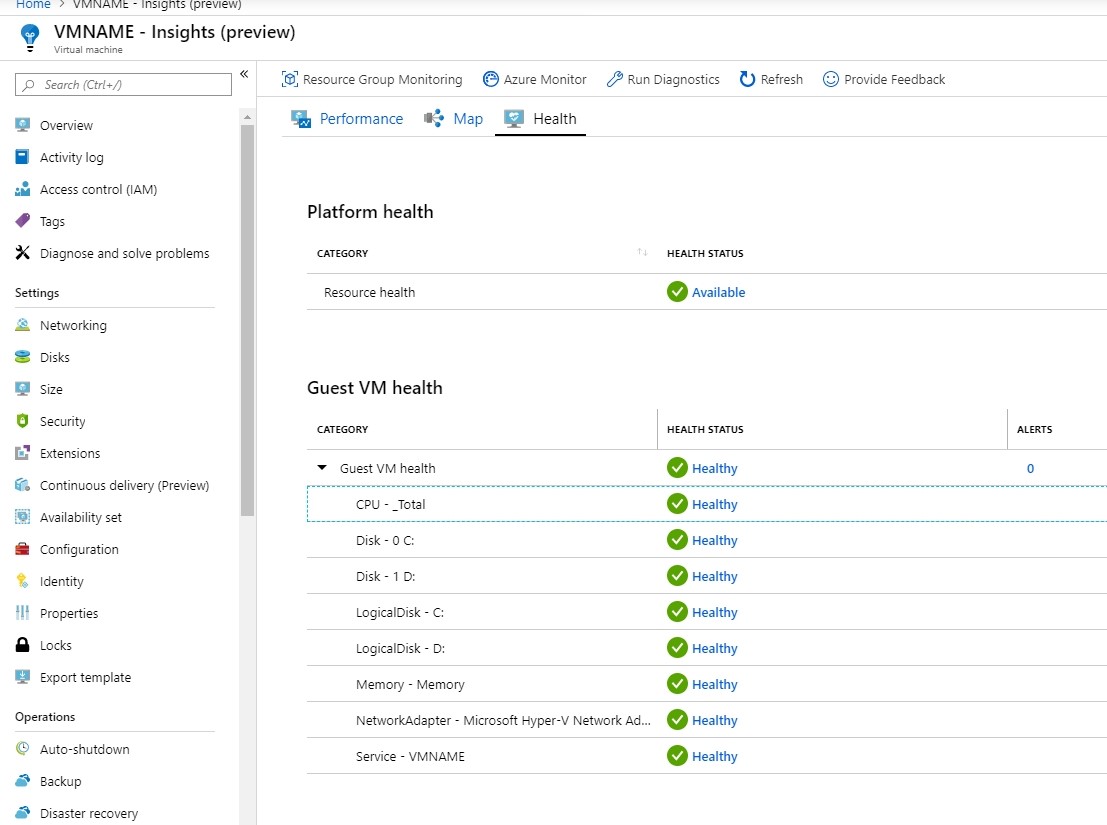
Azure Monitor for VMs will enable monitoring like you are used to. For those who are familiar with SCOM you will find yourself at home very quickly. The solution will surface operating system performance and health as well as core services and demons running. Health will be categorized in CPU, memory, network, and disk. On-premises and servers running in other clouds can also be monitored. Depending on your environment this could be beneficial. I expect more features being added to this solution in the future. A full health model in Azure Monitor is one of the most requested features.
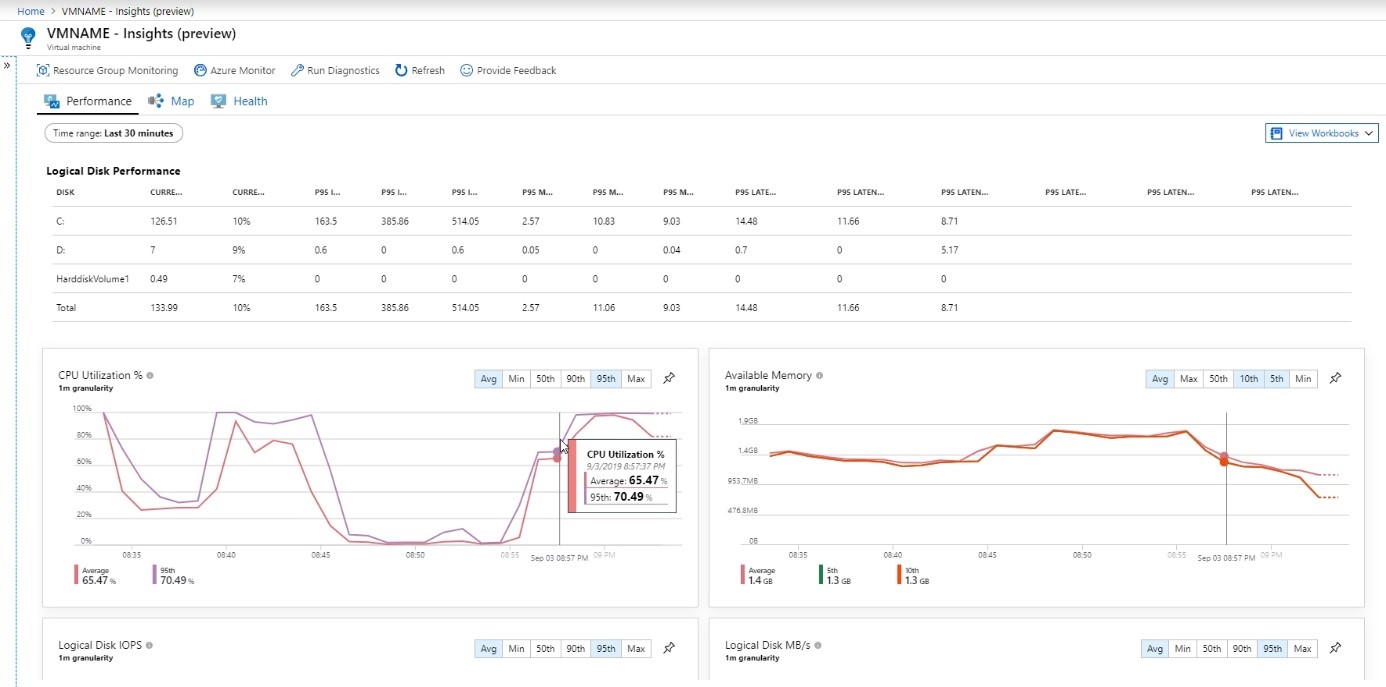
I am including a few screenshots from a VM with insights enabled. As you can see, we quickly get a more detailed view than we did with the platform metrics only.
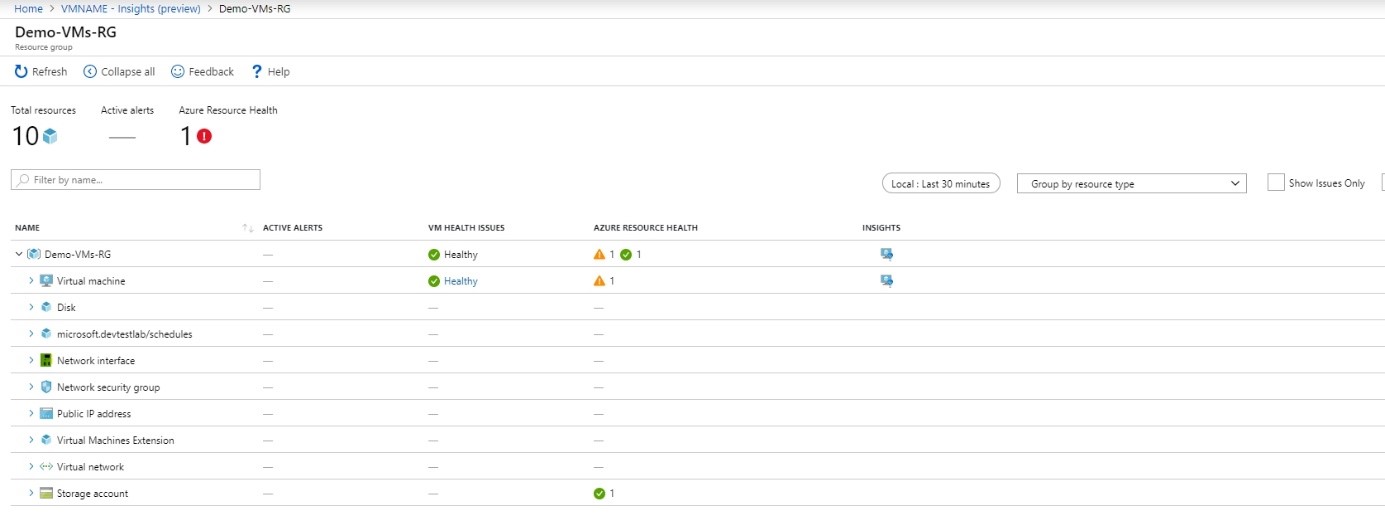
Apart from the guest OS metrics you get with insights. A similar solution is also available for storage accounts. With that, end-to-end monitoring can be available in a form of resource group health. This can be a great way to quickly identify what resources delivering your application have an issue. Either from the Azure platform itself, or inside your VM and storage accounts. I say can be great. That is because I have seen a few examples on bad governance in Azure, which this feature does not take into consideration. One example could be a VM with a database stored in a separate resource group.
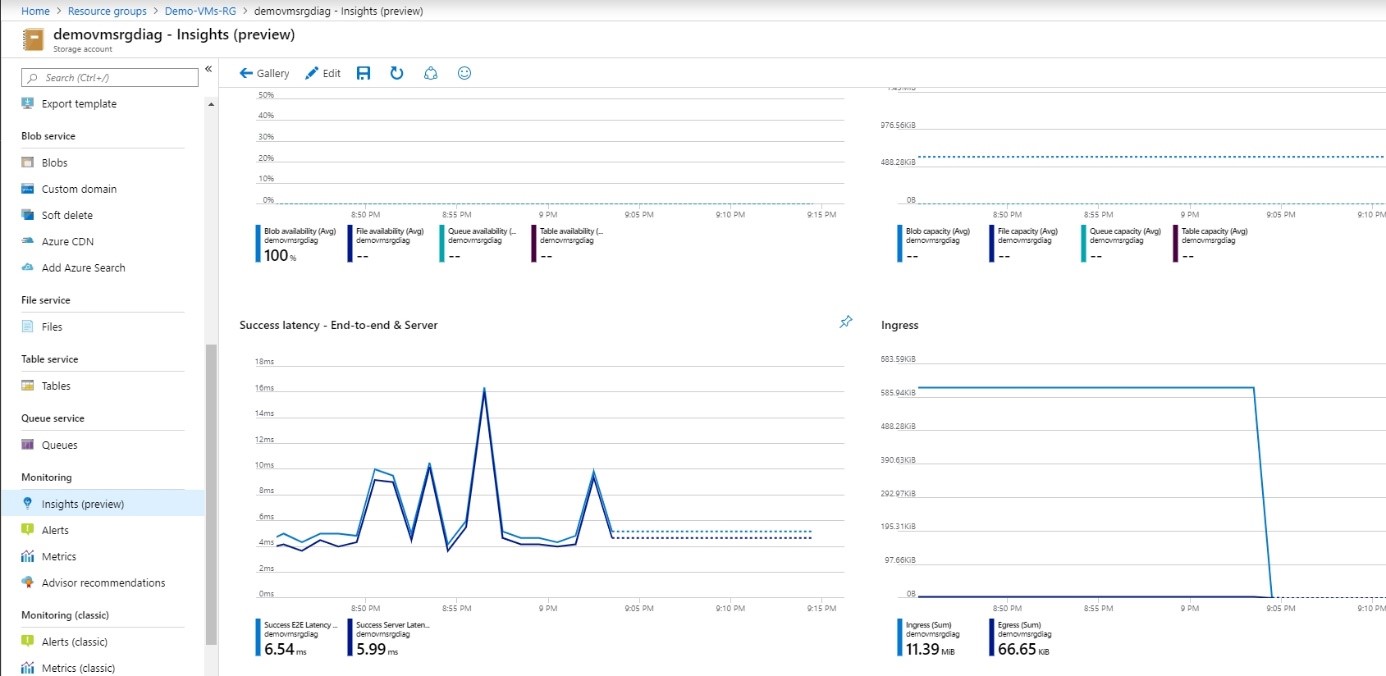
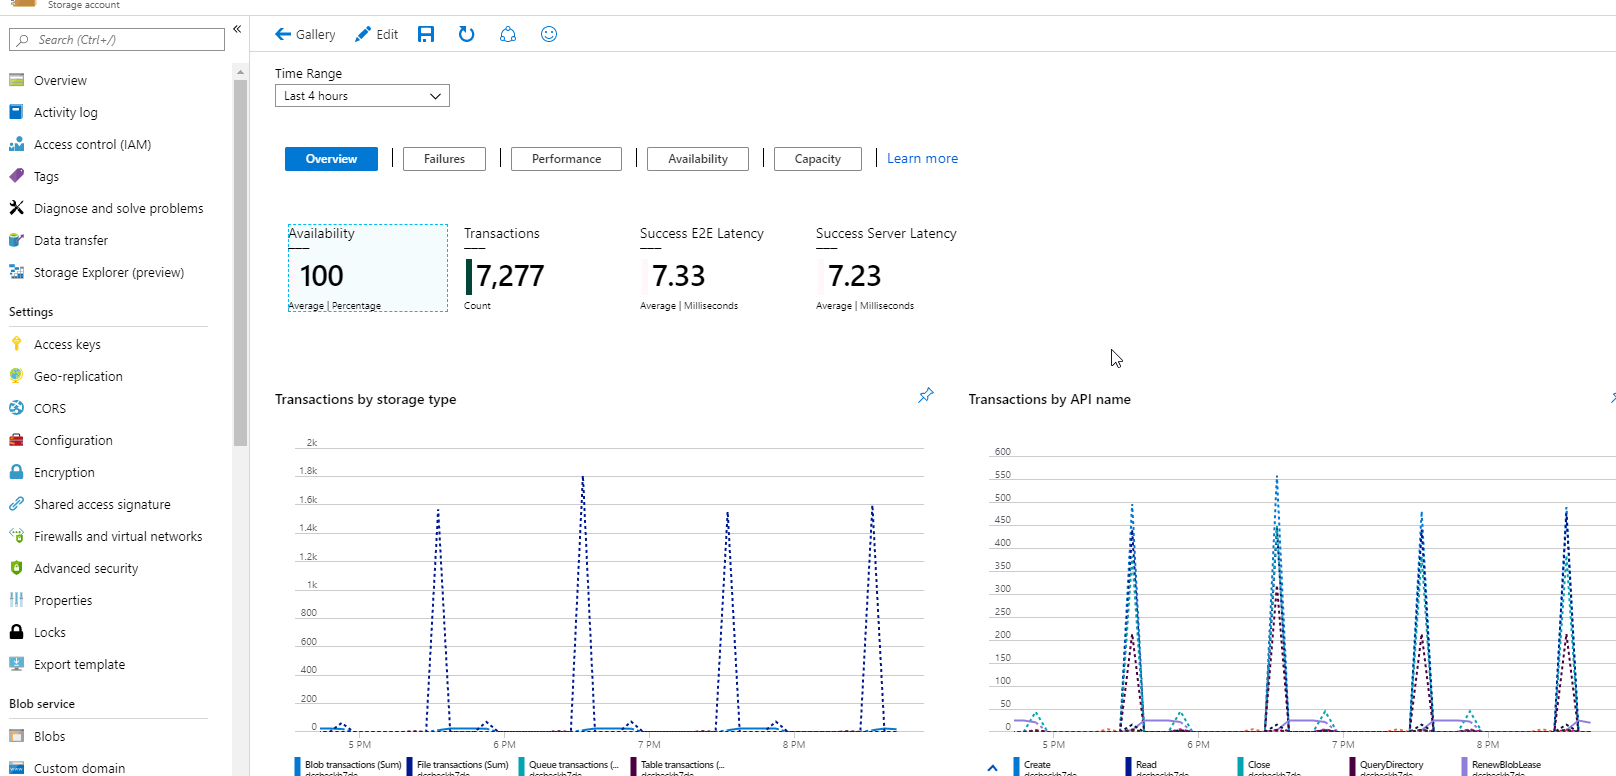
With storage account insights you get in-depth monitoring on performance and capacity of your storage accounts, as well as platform availability. Right away you will get an overview showing key metrics like transactions, capacity and latency.
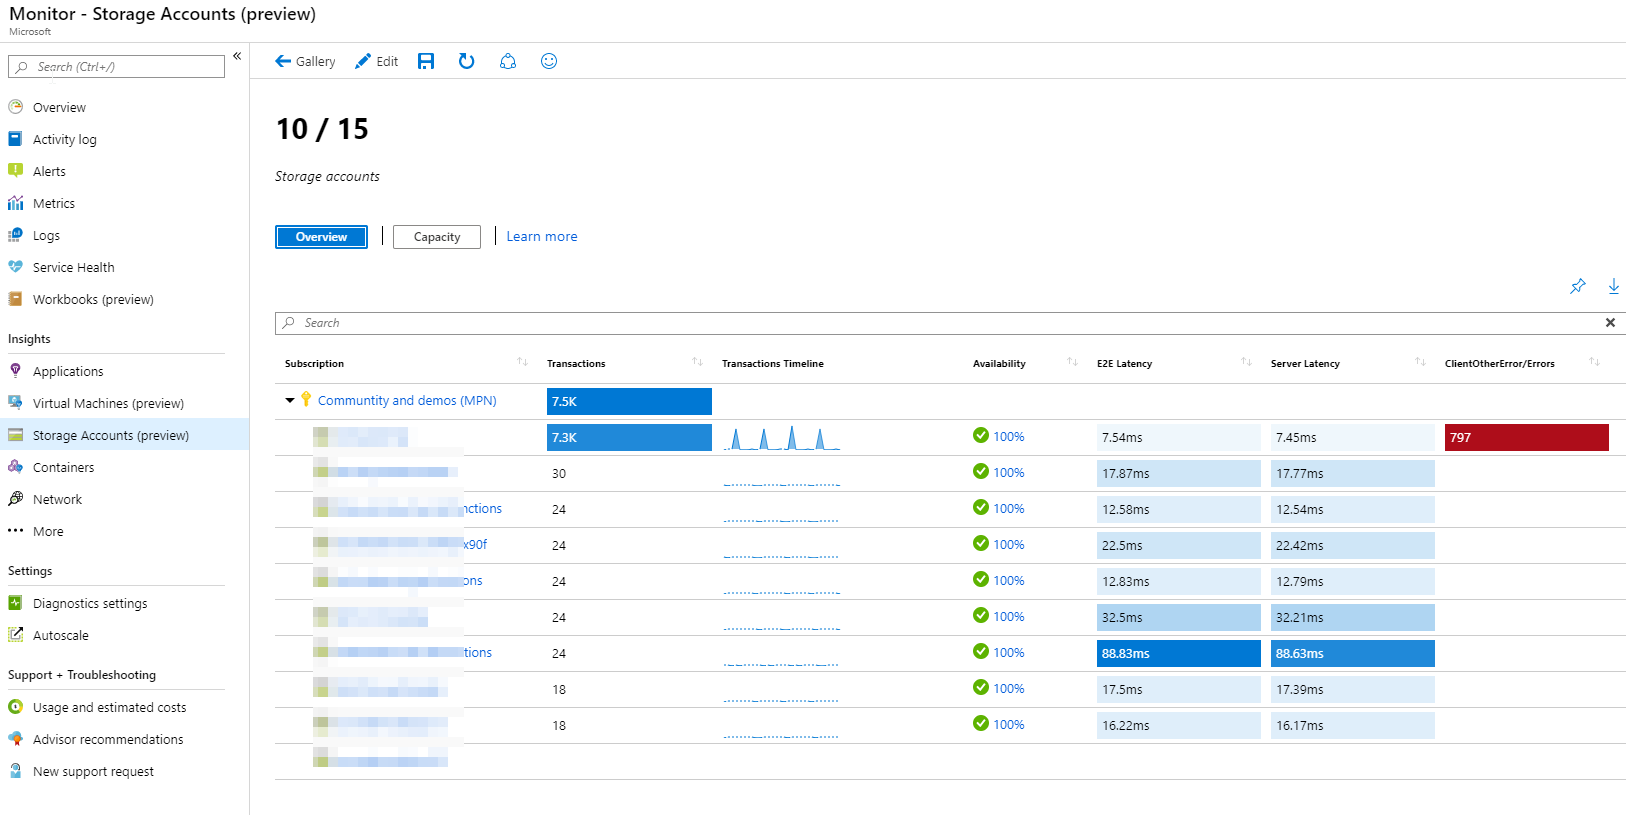
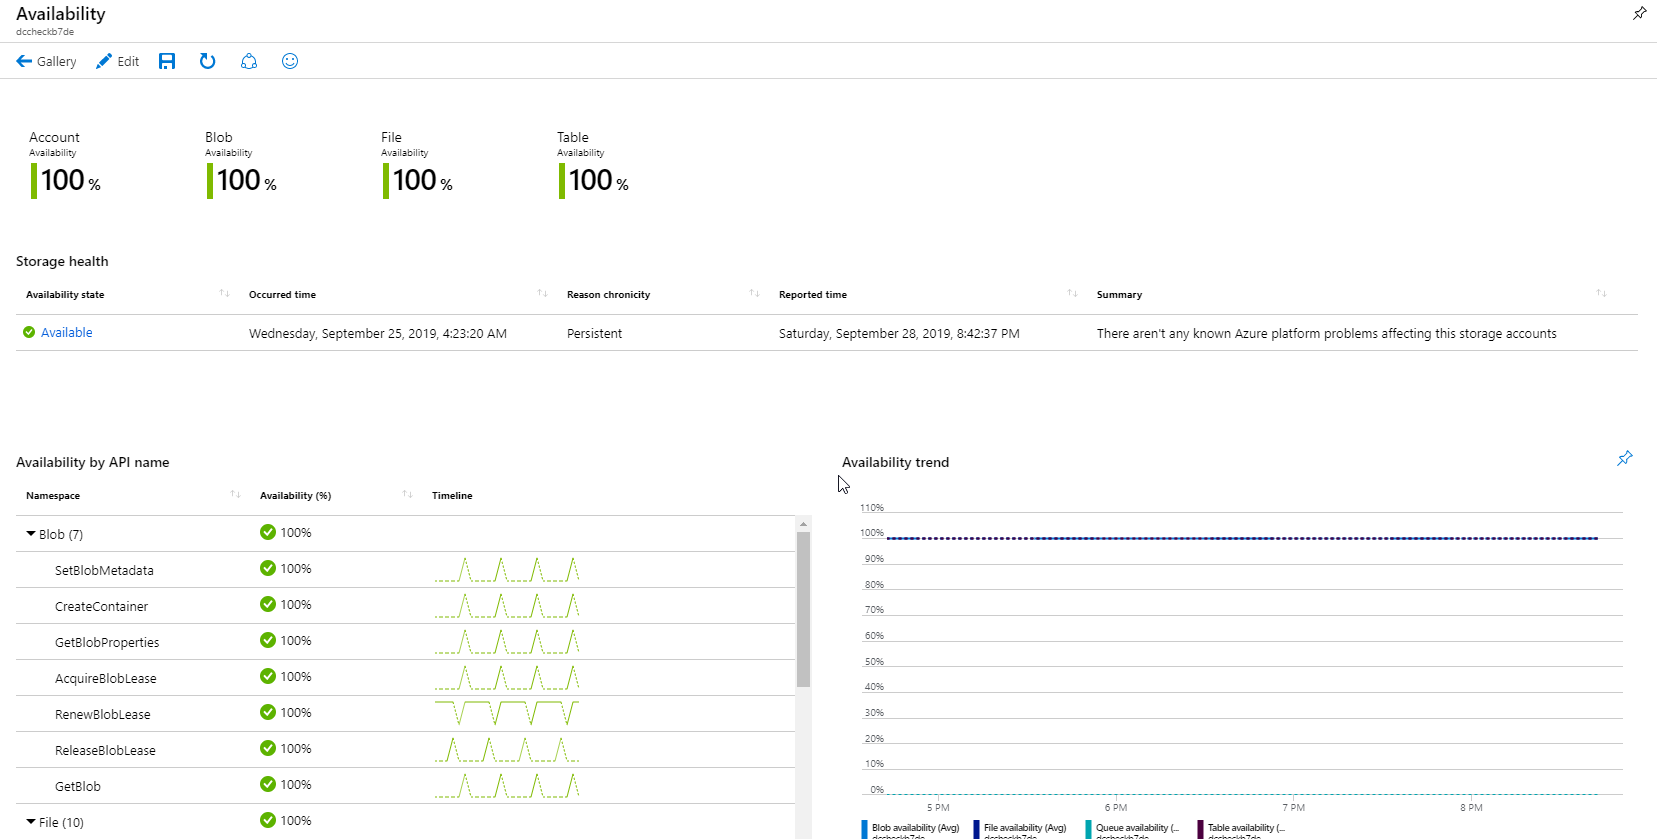
By using the drilldown capabilities, you can dive into each individual account and get more detailed information about its health. From here you can change perspective and see the details based on that.
For those who have worked with Azure’s monitoring platform for a while, you probably know that Microsoft has tried this with variable success earlier. Let’s see what this can build up to, but I am positive.
Although I only mentioned two Insight solutions here, I would watch this space as its changing fast.
At the time of writing, the following is available.
- Applications (this is application insights, now a part of Azure monitor)
- VM Insights (preview)
- Storage Account (preview)
- Containers
- Network (preview)
- Cosmos DB (preview)
Custom data
This is where it (to me) get interesting. As soon as you have control of the platform and guest OS monitoring. Chances are that you need custom data alongside what you already have. All monitoring platforms should have this capability, and Azure Monitor have multiple.
Custom metrics
If you have control over the code of your application, you can enable application insights, and from there send custom telemetry to Azure Monitor. Other ways to insert custom metrics are through VM agents for Linux and Windows based machines.
The last option is to use the API directly. If you have on-premises workloads working in conjunction with an application in Azure you can have that send it directly and analyze it seamlessly.
Custom logs
When custom metrics is available custom logs are as well. Custom logs have been around for years now, all the way back to Operations Management Suite (OMS) days. Now the marketing strategy has changed, and we are talking about Azure Monitor Logs and the custom log capabilities here.
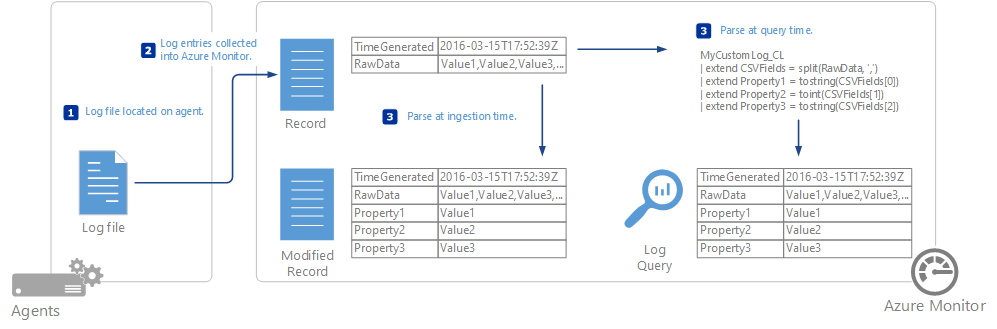
If the application installed on your server does not log to Syslog (Linux) or the Windows event log, chances are that they have their own log file. These logfiles can be collected into Azure Monitor (the log analytics workspace).
But what if your custom logs aren’t supported, or your metrics doesn’t apply to a resource in Azure? Then there’s only one option left, and it’s in my opinion the greatest feature in Azure Monitor.
The HTTP Data collector API lets you send “anything” to Azure Monitor.
Personally, I have used it to track and analyze my electric vehicle charging and power consumption. Starting charging based on energy pricing and so on. Another great example is this forecast for solar power generation created by Cameron Fuller
I encourage you to experiment and play with this. Once you get comfortable in this area of Azure Monitor there’s not much you cannot do.
Automation
One of the big differences with Azure Monitor compared to other monitoring systems is the Azure platform itself. As soon as you are looking into more advanced monitoring, automatic alert remediation, systems integration and so on. You will have to explore other parts of the Azure. Monitor has tight integration with products, like Azure Functions and Logic Apps. That means you will have to skill up on these products and their individual capabilities.
For example, if you want to send alerts to Microsoft Teams instead of email. Logic Apps would be a natural choice, as Logic apps already have an integration with Teams.
In the beginning, this might seem very complex (and it can be). But once you have done some automation and integration from Azure Monitor you will quickly see the advantage it has as part of Azure.
Summary
Even though it is a ‘new’ brand, parts of Azure Monitor have been around for quite some time. Most of the features were individual products. Until recently, Logs was only known as a product called Log Analytics. All this comes off as very confusing for individuals not following the scene on a regular basis.
I hope this blog post introducing you to the main features and capabilities within Azure Monitor to help you on your way. Microsoft’s official documentation is very good, but without clear knowledge of what to search for it can be challenging to get started.

More Microsoft technology professionals than anyone else.
Browse pre-qualified candidates now and find the talent you need to transform your business.
Meld u aan voor tips over Microsoft Azure en Dynamics
- Intelligent Cloud Developer-vacatures
- Intelligent Cloud Technisch Consultant-vacatures
- Intelligent Cloud Technisch Adviseur-vacatures
- Intelligent Cloud Project Manager-vacatures
- Intelligent Cloud Solutions Architect-vacatures
- Intelligent Cloud Business Analyst-vacatures
- Intelligent Cloud Technical Architect-vacatures
- Intelligent Cloud Systems Administrator-vacatures
- Intelligent Cloud Sales-vacatures
- Andere vacatures bij Intelligent Cloud
- Business Applications Developer-vacatures
- Business Applications Technisch Consultant-vacatures
- Business Applications Technisch Adviseur-vacatures
- Business Applications Project Manager-vacatures
- Business Applications Business Analyst-vacatures
- Business Applications Systems Administrator-vacatures
- Business Applications Technical Architect-vacatures
- Business Applications Solutions Architect-vacatures
- Business Applications Sales-vacatures
- Business Applications IT Manager-vacatures
- Andere vacatures bij Business Applications